
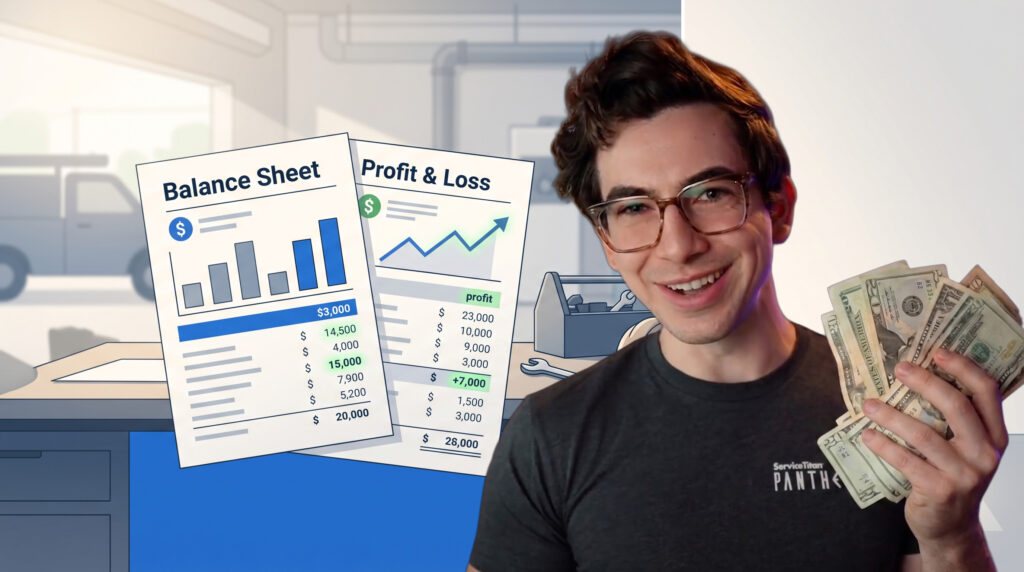
Where Did the Money Go? A Contractor’s Guide to Reading Your Own Financials
You were a great technician. Now you own a business and the money feels like a mystery. Here’s how to read the scorecard so you actually know if you’re winning.
So you went out on your own. You were good with your hands, sick of making someone else rich, and you figured running the business couldn’t be that hard. Then the first few months go by. You’re slammed with work. The phone won’t stop. And at the end of the month there’s nothing in the checking account and a stack of bills on the counter.
Where did it all go?
Here’s the thing nobody told you when you picked up the wrenches: being a great tech and running a profitable business are two completely different skills. The good news is the second one isn’t hard. It’s not even close to as hard as the trade you already mastered. You just need to learn to read the scorecard.
That’s all financial statements really are. A scorecard. They tell you whether you’re winning or losing so you can do something about it while there’s still time. In this guide I’ll walk you through the two reports that matter, using one simple example you can follow start to finish. By the end you’ll understand your own numbers well enough to make real decisions, and you’ll stop feeling like the money just disappears.
The math here is addition, subtraction, and a little division. That’s it. If a word sounds weird, I’ll define it the first time it shows up. Keep your own Balance Sheet and Profit & Loss handy if you’ve got them, and try to find each thing I mention on your own reports as we go.
The two scorecards: Balance Sheet and P&L
When people say “financial statements,” they almost always mean two reports:
- The Balance Sheet shows the financial condition of your company on a specific day. Think of it like a photo. It captures what you own, what you owe, and what’s left over, frozen at one moment in time.
- The Profit & Loss statement (also called the P&L or income statement) shows what happened over a stretch of time, usually a month or a year. It answers the question in the title of this post: where did the money go?
One is a snapshot. The other is the movie of what happened between snapshots. You need both. A single month of reports is like one basketball card. It tells you a little, but you can’t see if you’re getting better or worse until you stack them up over time. That’s where the real value is.
Let me say the most important thing up front, because it took me a while to believe it. You can’t hand this off. You can get help from a bookkeeper and an accountant, and you should. But it’s your money and your company. You have to know where it goes. The owners who make real money are the ones who read their own scorecard. So let’s learn to read it.
Start with the Balance Sheet
The whole Balance Sheet rests on one little formula. This is the foundation of all accounting, so it’s worth burning into your brain:
Three words, and they’re not as scary as they sound.
Assets are the stuff your company owns that has value. Cash, the money customers owe you, the parts on your truck, the truck itself. Accountants split assets into two buckets. Current assets are things you could turn into cash within about a year (cash itself, accounts receivable, inventory). Fixed assets are the things you use to run the business and wouldn’t sell off just to pay a bill, like your truck, tools, or a building.
Liabilities are what you owe to somebody else. A truck loan, a supply-house bill you haven’t paid yet, sales tax you’re holding. Same split here: current liabilities are due within a year, long-term liabilities give you more than a year to pay.
Equity is what’s actually yours once the debts are covered. It’s the money you put in plus the profit the business has earned and kept. If you sold everything and paid off everyone, equity is what would be left in your pocket.
That’s really it. What you have, and how you got it. Everything else is just detail hanging off those three pegs.
Let’s follow your first day in business
Theory only gets you so far. Let’s make it real. Say you’re starting a one-person plumbing shop, we’ll call it Summit Plumbing, and we’ll track every move you make. To keep it clean, pretend it all happens on one day: December 31.
Move 1: You put $5,000 of your own money into a business checking account
Cash goes up by $5,000. And because that money came from you, the owner, your equity goes up by $5,000 too. When an owner puts money in, accountants call it Paid-In Capital. It’s just a fancy label for “the owner’s own money.”
Notice the money got recorded twice. Once as an asset (cash), once as equity (your ownership). That’s double-entry accounting, and it’s the trick that keeps the formula balanced. Every transaction touches at least two places so the two sides always match. Watch it stay in balance the whole way through.
As of Dec 31 · after move 1
| Assets | |
| Cash | 5,000 |
| Total Assets | 5,000 |
| Liabilities & Equity | |
| Paid-In Capital (equity) | 5,000 |
| Total Liabilities & Equity | 5,000 |
$5,000 in assets, $5,000 in equity, zero owed. In balance.
Move 2: You buy a work truck for $15,000, and the dealer loans you the whole amount
Now you’ve got a $15,000 truck (a fixed asset) and a $15,000 loan (a liability called a Note Payable). You didn’t spend any of your cash. The company grew, but it grew on borrowed money. See how assets and liabilities both jumped by the same amount, so the books stay balanced?
As of Dec 31 · after move 2
| Assets | |
| Cash | 5,000 |
| Truck | 15,000 |
| Total Assets | 20,000 |
| Liabilities & Equity | |
| Note Payable — truck loan | 15,000 |
| Paid-In Capital (equity) | 5,000 |
| Total Liabilities & Equity | 20,000 |
The company is bigger, but it’s “Other People’s Money” doing it. $20,000 = $15,000 owed + $5,000 yours.
Move 3: You stock up on $3,000 of parts, paid in cash
This one’s sneaky and it’s where a lot of new owners get tripped up. You traded one asset for another. Cash drops by $3,000, inventory shows up at $3,000. Your total assets didn’t change at all. But look closer. You started the day with $5,000 in cash and now you’ve got $2,000. Same net worth, very different cash position.
As of Dec 31 · after move 3
| Assets | |
| Cash | 2,000 |
| Inventory | 3,000 |
| Truck | 15,000 |
| Total Assets | 20,000 |
| Liabilities & Equity | |
| Note Payable — truck loan | 15,000 |
| Paid-In Capital (equity) | 5,000 |
| Total Liabilities & Equity | 20,000 |
Total assets unchanged at $20,000, but cash went from $5,000 to $2,000. Of all your assets, cash is the one to watch.
Cash is king. Your truck is worth something, but you can’t pay this month’s phone bill with a truck. A growing business can run out of cash fast by tying it all up in inventory or equipment, even when the Balance Sheet looks healthy. Keep an eye on the cash line specifically, not just the bottom total.
One quick gut-check the bank will run on you here. Compare your current assets to your current liabilities. That’s your current ratio, and you want at least 2 to 1, meaning twice as much in current assets as you owe in short-term bills. It’s how the bank decides whether you can pay your bills on time. Worth knowing your own number before they tell you.
Now the P&L: where the money actually goes
The Balance Sheet shows your condition. The Profit & Loss shows your performance. Its formula is even simpler:
Let’s run your first real job. Mrs. Lawson down the street needs a water heater installed. Here’s the job:
On the P&L, that looks like this:
The water heater job
| Income | |
| Sales | 450 |
| Cost of Goods Sold (direct costs) | |
| Materials | 160 |
| Billable labor | 135 |
| Permit | 15 |
| Total Cost of Goods Sold | 310 |
| Gross Profit | 140 |
Sales minus direct costs equals gross profit. Looks like you made $140. Hold that thought.
Two new terms there, and they’re the most important idea in this whole guide.
Direct costs (also called Cost of Goods Sold, cost of sales, or job-site expenses) are the costs tied to a specific job. If the job didn’t happen, you wouldn’t have spent the money. The water heater, your labor on that job, the permit. Most owners understand these and charge enough to cover them.
Gross profit is what’s left after you subtract direct costs from the sale. On this job, $140. That money is supposed to cover everything else and still leave you a profit. Which brings us to the part that sinks most new businesses.
The mistake that quietly kills contractors
While you were out installing that water heater, bills were piling up back at the office. Insurance. Advertising. Your phone. Truck repairs. The fuel. These don’t belong to any one job, so they’re easy to forget when you’re pricing work. They’re called indirect costs, or overhead.
Indirect costs are every expense that isn’t a direct cost. They keep a roof over the business whether you did ten jobs today or zero. The phone bill shows up even on a slow day. You can’t pin overhead to a single customer, so every price you quote has to carry a slice of it.
Here’s the kicker. Your owner’s salary is overhead too. When you’re turning wrenches, that’s billable labor, a direct cost. But when you’re answering the phone, running for parts, doing paperwork, or quoting jobs, you’re doing management work, and you deserve to get paid for it. That pay is an indirect cost.
Now let’s look at your whole first day with all the overhead included. Same $600 in sales (the water heater plus a small parts sale), but this time nothing is hidden. I added a percentage column, because once you’re comparing months, the percentages tell the story faster than the dollars.
Day one · the honest version
| Income | ||
| Sales | 600 | 100.0% |
| Cost of Goods Sold (direct) | ||
| Materials | 255 | 42.5% |
| Billable labor | 135 | 22.5% |
| Permits | 15 | 2.5% |
| Total COGS | 405 | 67.5% |
| Gross Profit | 195 | 32.5% |
| Overhead (indirect) | ||
| Owner’s salary | 225 | 37.5% |
| Advertising | 35 | 5.8% |
| Truck maintenance | 30 | 5.0% |
| Professional services | 25 | 4.2% |
| Uniforms | 20 | 3.3% |
| Tools | 15 | 2.5% |
| Insurance | 10 | 1.7% |
| Office supplies | 10 | 1.7% |
| Education | 5 | 0.8% |
| Total Overhead | 375 | 62.5% |
| Net Income | −180 | −30.0% |
$600 of sales and you still lost $180. That’s a negative 30% day. This is exactly how busy contractors go broke.
Read that bottom line again. You did $600 in sales and lost $180. And here’s the part that really gets people: you still had cash in the bank at the end of the day. That’s the trap. The cash made it feel like things were fine. The scorecard says otherwise.
You did not lose money because business was bad. You lost it because the price was pulled out of thin air and never covered the real cost of doing the work. Most contractors price by copying the guy down the road. But what makes you think he knows what he’s doing? Price from your own costs, not from “what the market charges.”
Net income connects the two reports
Quick but important. That bottom line on the P&L, the net income, flows straight into the equity section of your Balance Sheet. A profit increases your equity. A loss chips away at it. So the P&L is really a magnifying glass on how your equity changed. The two reports aren’t separate. They’re two views of the same business.
The number that controls your whole business: billable hours
Why did that day lose money? Look at your time. You had 8 hours, but only 3 of them were billable, the water heater install. The rest went to the parts run, paperwork, and washing the truck. Necessary work, but not work you billed a customer for.
A billable hour is an hour you actually sell to a customer. Your billable hour efficiency is billable hours divided by total hours. On day one that’s 3 out of 8, or about 38%. That number quietly drives everything on your financials.
There’s a myth I want to kill right here: “I run a small shop, so my overhead is low, that’s how I charge less.” Nonsense. Yes, a small shop spends fewer total dollars on overhead. But it also has way fewer billable hours to spread that overhead across. With only 3 billable hours a day, every one of them has to carry a big chunk of your costs. A bigger shop spreads the same kind of overhead over way more billable hours. It’s common for the small shop to have a higher cost per billable hour, not lower.
Break-even is the point where you cover all your costs but don’t make a profit yet. Handy number to know.
Price your billable hour to cover all your costs plus profit, based on a realistic number of billable hours, not a perfect fantasy day. Then any materials you sell on top are gravy. That one shift is the whole ballgame.
Profit and cash are not the same thing
This one confuses everybody at first, so don’t feel bad if it takes a minute. You can be profitable and still be broke. You can have plenty of cash and still be losing money. Both are true and both are common.
How? Accounts receivable. When you finish a job and the customer says “I’ll pay you next month,” you earned the revenue and the profit today, but the cash isn’t here yet. That promise to pay is an asset called accounts receivable (A/R). Your P&L can show a great profit while your checking account is empty because it’s all stuck in A/R. So when you’re profitable on paper but cash is tight, your first move is usually to go collect.
While we’re here, one more pair of terms. Most accounting software lets you run reports on a cash basis or an accrual basis. Cash basis records money when it actually moves. Accrual basis records revenue when you earn it and expenses when you incur them, even if the cash comes later. For running your business, accrual gives you the truer picture. It’s worth setting your internal reports to accrual so you’re seeing reality, not just your bank balance.
A couple of ratios that tell you the truth fast
You don’t need a finance degree. A few ratios will tell you most of what you need. Here’s a Balance Sheet for a company in trouble, the kind of mess that’s easy to land in during year one. Let’s read it.
End of year one
| Current Assets | |
| Cash | 2,459 |
| Accounts Receivable | 19,870 |
| Inventory | 12,745 |
| Total Current Assets | 35,074 |
| Fixed Assets | |
| Truck (original cost) | 18,000 |
| Accumulated depreciation | −3,000 |
| Total Fixed Assets | 15,000 |
| Total Assets | 50,074 |
| Current Liabilities | |
| Accounts Payable | 8,654 |
| Credit Card | 26,988 |
| Total Current Liabilities | 35,642 |
| Note Payable — truck loan (long term) | 12,500 |
| Total Liabilities | 48,142 |
| Equity | |
| Paid-In Capital | 5,000 |
| Net Income | −3,068 |
| Total Equity | 1,932 |
| Total Liabilities & Equity | 50,074 |
Still balances (50,074 = 48,142 + 1,932), but the story underneath is rough. Let’s pull two ratios.
Quick aside on one line there: accumulated depreciation. Tax rules let you spread the cost of a big item like a truck over several years instead of expensing it all at once. Each year a piece of it shows up as a depreciation expense on the P&L, and it piles up under the asset on the Balance Sheet as accumulated depreciation. So the truck shows at $18,000 cost with $3,000 worn off, leaving $15,000 on the books. It’s a paper expense, not a check you write each month.
Quick ratio
This compares your cash and A/R (the stuff you could turn into cash quickly) to your current liabilities. Inventory’s left out because you can’t always sell it fast.
You’ve got 63 cents of quick money for every dollar you owe soon. That’s not good. And most of even that is tied up in A/R, so the move is clear: go collect. Aim to get this up around 1.5 to 1.
Debt-to-equity ratio
This compares everything you owe to everything that’s actually yours.
For every dollar that’s yours, you owe twenty-five. That’s a deep hole. How much debt you carry is your call, but a lot of owners aim for 3 to 1 or better. The fix for almost everything on a Balance Sheet like this is the same: profit. Generate real profit, steer it into cash instead of more A/R, and pay down those current liabilities. The ratios climb, and you can breathe again.
What it looks like when you get it right
Let’s not end on the sad one. Say you learned the lesson, reset your prices to cover your real costs, hired a second tech, and ran a full year paying attention to the scorecard. Here’s year two.
Year 2 · Jan–Dec
| Sales | 300,000 | 100.0% |
| Total Cost of Goods Sold | 120,000 | 40.0% |
| Gross Profit | 180,000 | 60.0% |
| Owner’s salary | 45,000 | 15.0% |
| All other overhead | 66,000 | 22.0% |
| Total Overhead | 111,000 | 37.0% |
| Net Ordinary Income | 69,000 | 23.0% |
| Taxes | 9,000 | 3.0% |
| Net Income | 60,000 | 20.0% |
$60,000 in profit AND $45,000 in owner’s pay. That’s the difference between guessing at prices and pricing from your costs.
Look what changed. Same kind of work, but now you’re paying yourself a real $45,000 salary and the company cleared $60,000 in profit on top of that. That’s the whole point. You need both. Your salary pays you for the time and headache. The profit is the company’s reward for the risk, and it’s what funds your next truck, your next hire, or your retirement.
A lot of owners think they’ll just scoop up whatever’s left at year end and call that their pay. Wrong. Pay yourself a real salary as a cost of doing business, and treat profit as separate. If you don’t build both into your prices, you’ll work yourself to the bone and have nothing to show for it.
The habit that makes all of this work
Reading one set of statements is a start. The magic is in doing it every month, on repeat, so you spot trends and catch problems while they’re small. Here’s the simple routine I’d run:
- Run your Balance Sheet and P&L every month. Close out the previous month and have the reports ready by around the 10th. If you’re profitable every month, you’re profitable for the year. Easy.
- Watch the percentage column, not just the dollars. Dollars jump around. Percentages show you the real trend, like whether your gross profit is holding up.
- Compare. This month vs. last month, this month vs. the same month last year, actual vs. your budget. One report is a single basketball card. The comparison is where the truth lives.
- Track your billable hours. This isn’t on your financial statements. You pull it from timesheets and invoices. Know your break-even per hour.
- Check that the data going in is clean. Garbage in, garbage out. If the bookkeeping is sloppy, your reports lie to you. Make sure whoever’s entering data knows where things go.
- Don’t just file them. Use them. Ask what changed and why. Talk to anyone on your team about the numbers. Pick one thing to improve next month.
Wrapping up
That’s really it. The Balance Sheet shows what you have, what you owe, and what’s yours. The P&L shows where the money went and whether you made any. Direct costs are tied to the job, overhead keeps the lights on, and your price has to cover both plus profit, spread across a realistic number of billable hours. Cash and profit aren’t the same thing, so watch both.
You don’t have to become a bookkeeper. You just have to be able to read your own scorecard and make decisions from it. The owners who do this win, not because they’re smarter, but because they stopped guessing. You already did the hard part by learning a trade. This part is easier, I promise. Keep score, run the reports every month, and the money stops being a mystery.
Now go find out where yours is going.
Numbers in this guide are illustrative and rounded for teaching. This is general education, not tax or accounting advice. For your own books, work with a bookkeeper or accountant who’ll teach you as they go.